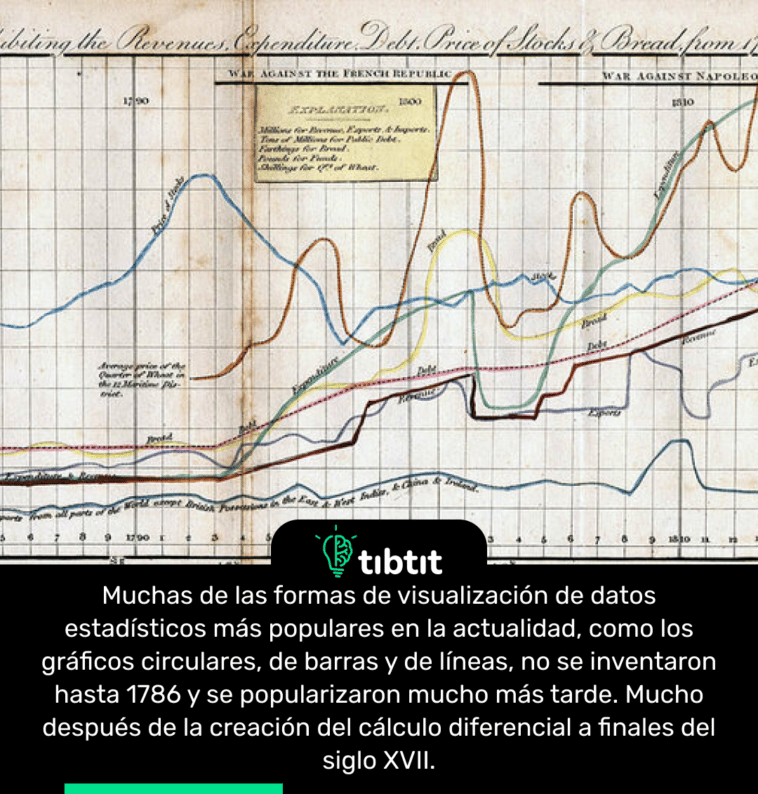
Fuente: The Scottish Scoundrel Who Changed How We See Data
Sabías que… datos estadisticos

Enter your account data and we will send you a link to reset your password.
To use social login you have to agree with the storage and handling of your data by this website.
AcceptHere you'll find all collections you've created before.
Muchas de las formas de visualización de datos estadísticos más populares en la actualidad, como los gráficos circulares, de barras y de líneas, no se inventaron hasta 1786 y se popularizaron mucho más tarde. Mucho después de la creación del cálculo diferencial a finales del siglo XVII.